Title
How to change the width of bars in a bar chart?
Description
I am using vchart to create a bar chart and I want to set the width of the bars. However, I couldn't find the corresponding configuration item in the documentation. I tried some parameters, but none of them worked. How can I set the width of the bars?
Solution
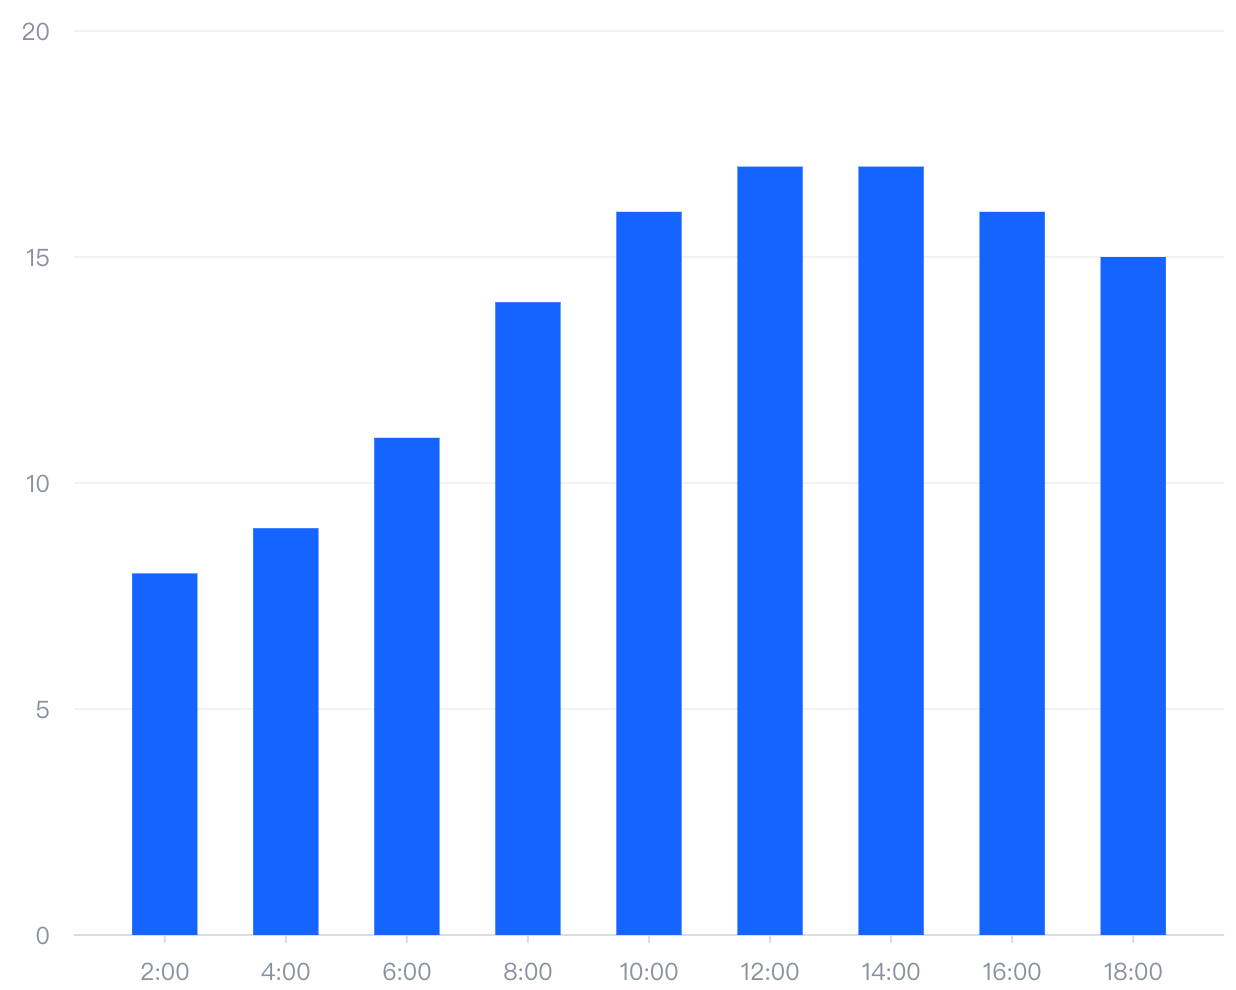
To set the width of the bars in a vchart bar chart, you can adjust the width of the chart itself. The bar chart has a barWidth property that can be used to adjust the width of the bars.
Example Code
const spec = {
  type: 'bar',
  data: {
    values: [
      {
        time: '2:00',
        value: 8
      },
      {
        time: '4:00',
        value: 9
      },
      {
        time: '6:00',
        value: 11
      },
      {
        time: '8:00',
        value: 14
      },
      {
        time: '10:00',
        value: 16
      },
      {
        time: '12:00',
        value: 17
      },
      {
        time: '14:00',
        value: 17
      },
      {
        time: '16:00',
        value: 16
      },
      {
        time: '18:00',
        value: 15
      }
    ]
  },
  barWidth: '60%',
  barMinWidth: 20,
  barMaxWidth: 50,
  xField: 'time',
  yField: 'value',
};

const vchart = new VChart(spec, { dom: CONTAINER_ID });
vchart.renderSync();

// Just for the convenience of console debugging, DO NOT COPY!
window['vchart'] = vchart;</br>
Result

Related Documentation
barWidthconfiguration: https://visactor.bytedance.net/vchart/option/barChart#barWidth- VChart github: https://github.com/VisActor/VChart
